
For decades, property management reporting followed a predictable pattern.
Owners received a monthly PDF.
It included:
- Income collected
- Expenses
- Occupancy
- Bank balances
The report was archived.
Sometimes reviewed.
Rarely analyzed.
In 2026, that approach is no longer sufficient.
Institutional investors now expect operational visibility similar to what CFOs receive inside major corporations.
Because today's competitive advantage isn't simply owning better real estate.
It's making better decisions—faster.
That begins with data.
Why Monthly Reporting Matters More Than Ever
The U.S. multifamily market has become increasingly dynamic.
Interest rates remain elevated compared to the previous decade.
Insurance costs continue rising in many markets.
Operating expenses remain under pressure.
Residents have more choices.
New supply continues entering several Sun Belt markets.
Waiting until quarter-end—or worse, year-end—to identify operational problems can be extremely expensive.
The best investors identify trends while they are still manageable.
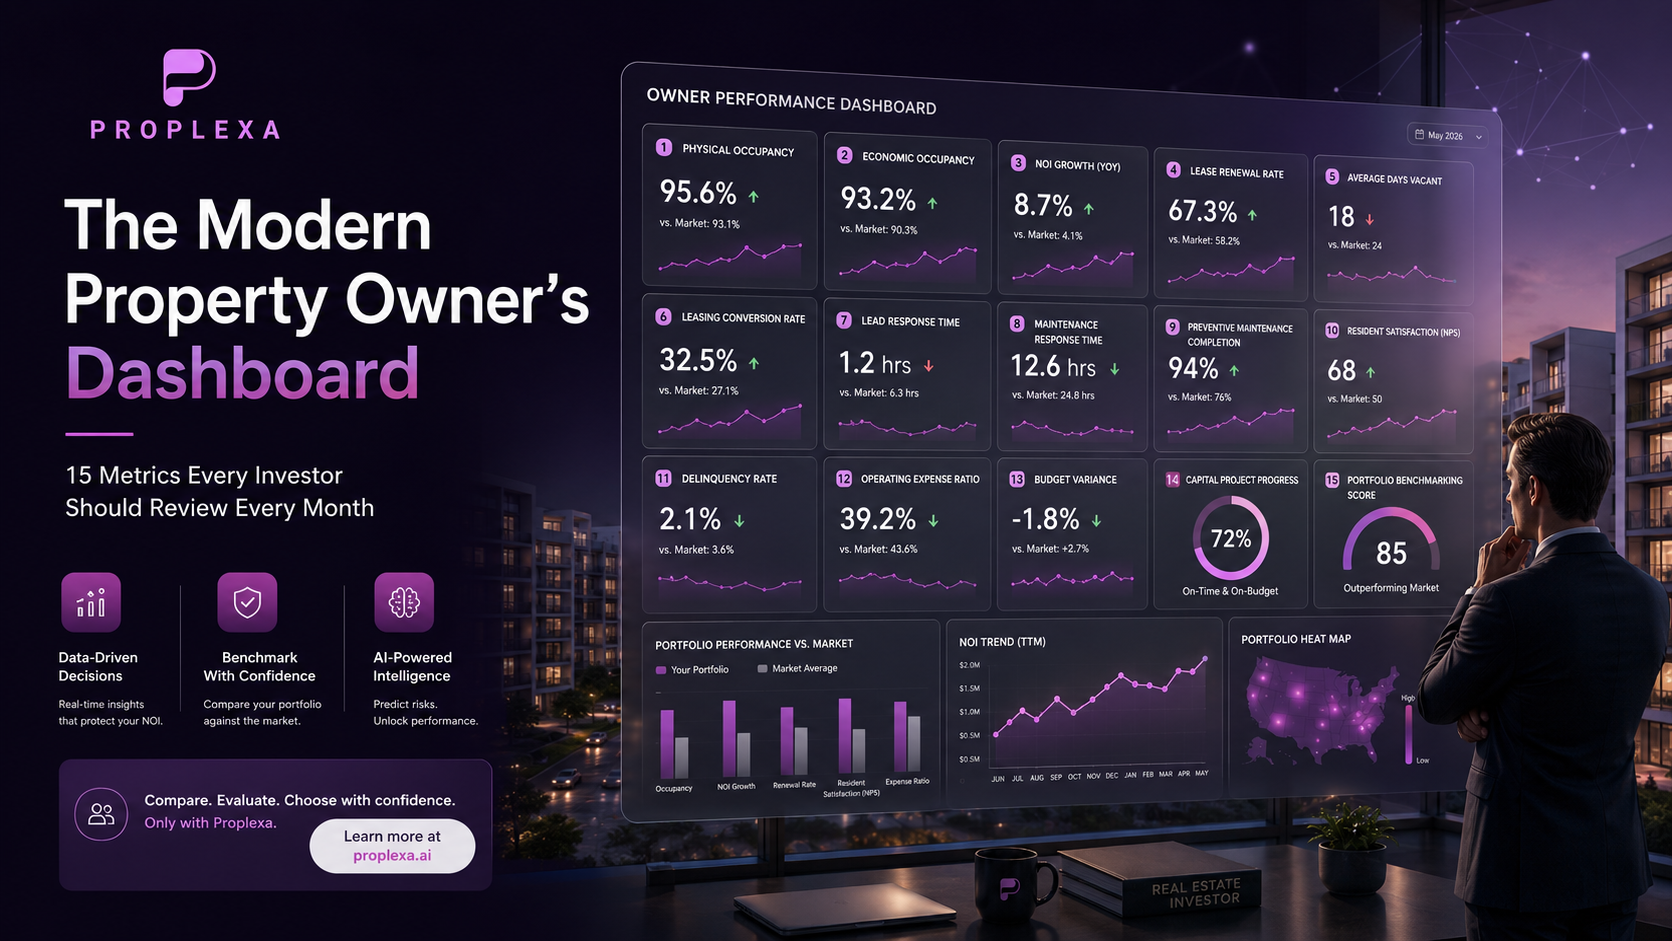
Metric #1: Physical Occupancy
This measures the percentage of occupied units.
Although widely reported, occupancy alone rarely tells the complete story.
High occupancy with excessive concessions or poor collections may hide underlying weaknesses.
Metric #2: Economic Occupancy
Economic occupancy measures actual revenue collected compared with potential revenue.
It incorporates:
- Vacancies
- Delinquencies
- Concessions
- Bad debt
Sophisticated owners increasingly prioritize economic occupancy over physical occupancy because it reflects actual financial performance.
Metric #3: Net Operating Income (NOI)
Every operational decision ultimately affects NOI.
Owners should monitor:
- Monthly NOI
- Rolling 12-month NOI
- Budget variance
- Year-over-year growth
NOI remains the single most influential operating metric affecting property value.
Metric #4: Lease Renewal Rate
Retention is one of the strongest predictors of future cash flow stability.
Higher renewals generally mean:
Lower turnover.
Lower leasing expenses.
Lower make-ready costs.
More predictable revenue.
Metric #5: Average Days Vacant
Every additional day a unit remains vacant reduces annual revenue.
Top-performing management companies monitor vacancy duration at the unit level—not just portfolio averages.
Metric #6: Leasing Conversion Rate
How many property tours become signed leases?
Strong conversion rates often indicate:
- Effective leasing teams
- Competitive pricing
- Strong resident experience
- Efficient follow-up
Metric #7: Lead Response Time
Industry research consistently shows leasing conversion declines as response times increase.
Leading operators now measure response times in minutes rather than hours.
AI-powered leasing assistants increasingly enable near-instant engagement.
Metric #8: Maintenance Response Time
Maintenance performance influences:
Resident satisfaction.
Renewal rates.
Online reputation.
Emergency repair costs.
Owners should track:
Average response time.
Average completion time.
Open work orders.
Overdue work orders.
Metric #9: Preventive Maintenance Completion Rate
Reactive maintenance is expensive.
Preventive maintenance protects asset value.
Professional operators increasingly measure the percentage of scheduled preventive tasks completed on time.
Metric #10: Resident Satisfaction (NPS or CSAT)
Resident sentiment has become increasingly measurable.
Satisfied residents renew more frequently, recommend communities, and generate fewer complaints.
Ignoring resident satisfaction often means overlooking future revenue risks.
Metric #11: Delinquency Rate
Rent collection remains fundamental.
Owners should monitor:
Current delinquency.
Historical trends.
Payment plan performance.
Collection effectiveness.
Even small increases can materially affect cash flow.
Metric #12: Operating Expense Ratio
Monitoring expenses without context can be misleading.
Benchmarking operating expenses against comparable properties provides far greater insight than evaluating costs in isolation.
Metric #13: Budget Variance
How closely does actual performance align with projections?
Large variances often indicate:
Pricing issues.
Unexpected repairs.
Poor forecasting.
Operational inefficiencies.
Monthly variance analysis helps owners respond before small deviations become large financial problems.
Metric #14: Capital Project Progress
Capital improvements affect both resident satisfaction and asset appreciation.
Professional reporting should include:
Project status.
Budget consumed.
Completion timeline.
Expected ROI.
Owners should never lose visibility into capital deployment.
Metric #15: Portfolio Benchmarking
Perhaps the most valuable metric isn't a metric at all.
It's comparison.
Is 95% occupancy good?
It depends.
Compared with:
Your market?
Your competitors?
Properties of similar age?
Similar asset class?
Professional benchmarking transforms isolated numbers into actionable intelligence.
Data Alone Doesn't Create Better Decisions
Many property management companies already generate enormous amounts of data.
The challenge isn't information.
It's clarity.
The best owner dashboards answer questions like:
Are we outperforming the market?
Where is NOI leaking?
What trends require attention?
Which KPIs are improving?
Where should capital be allocated?
Reporting should drive decisions—not simply document history.
Transparency Is Becoming a Competitive Advantage
Sophisticated investors increasingly expect:
Real-time dashboards.
Interactive reporting.
Benchmark comparisons.
Predictive analytics.
Automated alerts.
AI-generated operational insights.
Monthly PDFs are gradually giving way to continuously updated business intelligence platforms.
Transparency builds trust.
Trust improves owner relationships.
Better relationships lead to longer management contracts.
Why This Matters for Property Owners
Choosing the right property management company isn't simply about selecting the lowest fee.
It's about selecting the team capable of delivering meaningful operational visibility.
When owners understand exactly how their assets perform, they make better investment decisions.
That includes:
Refinancing.
Capital improvements.
Acquisitions.
Disposition timing.
Portfolio expansion.
Without reliable reporting, those decisions become guesswork.
How Proplexa Helps Owners Make Better Decisions
Comparing property management companies shouldn't stop at pricing.
Owners should also compare:
Reporting quality.
Technology platforms.
Dashboard capabilities.
Performance metrics.
Transparency.
Benchmarking.
Proplexa enables property owners to evaluate multiple management companies side by side—helping investors identify firms that deliver both operational excellence and meaningful reporting.
Because the best property managers don't just manage buildings.
They provide the information owners need to grow wealth with confidence.
Final Thoughts
Every multifamily property generates thousands of data points every month.
Only a handful truly determine investment performance.
The most successful investors focus on those signals, review them consistently, and partner with property managers who provide complete operational transparency.
In 2026, competitive advantage isn't just about owning better assets.
It's about seeing those assets more clearly than everyone else.