
Ask most property owners how their portfolio is performing, and you'll often hear a familiar response:
"Our occupancy is 95%."
"Our renewals are improving."
"Our expenses are under control."
Those numbers may sound encouraging.
But they raise an important question:
Compared to what?
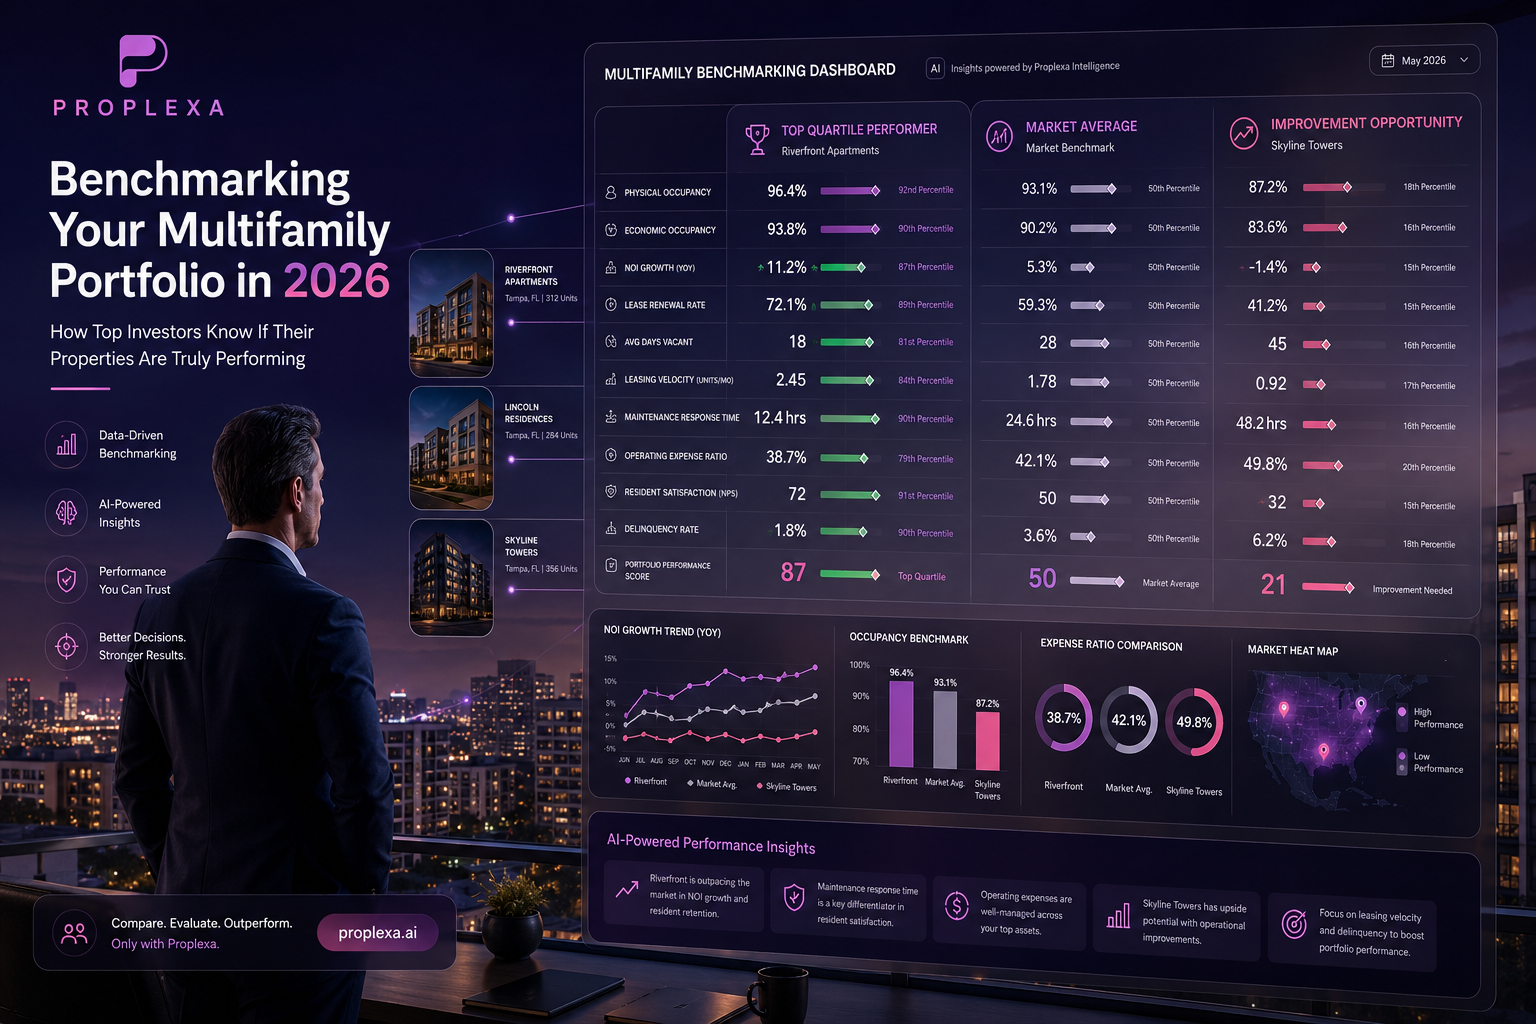
In 2026, the most sophisticated real estate investors no longer evaluate performance in isolation.
They evaluate it against the market.
Because numbers without context rarely lead to better decisions.
Benchmarking provides that context.
Why Benchmarking Has Become Essential
The multifamily industry has become increasingly data-driven.
Owners now have access to more information than ever before:
Occupancy trends.
Rent growth.
Renewal rates.
Leasing velocity.
Operating expenses.
Resident satisfaction.
NOI performance.
Yet data alone doesn't create insight.
The real advantage comes from knowing how your property compares to similar assets in the same market.
Institutional investors benchmark virtually every operational metric because relative performance—not absolute performance—is what identifies opportunities.
A "Good" Occupancy Rate May Actually Be Underperforming
Imagine your community reports:
95% Physical Occupancy.
At first glance, that appears excellent.
But suppose comparable Class A properties within a three-mile radius are averaging:
97.6%.
That 2.6% difference may represent dozens of vacant unit-days over the course of a year.
For a 250-unit community with average monthly rents of $2,100, even a small occupancy gap can translate into well over $100,000 in annual revenue opportunity.
Benchmarking transforms a "good" metric into an actionable insight.
Benchmark #1: Physical Occupancy
Occupancy remains one of the industry's most visible metrics.
However, owners should compare occupancy against:
- Competitive properties
- Asset class
- Building age
- Neighborhood
- Market averages
A stabilized Class B property should not necessarily be compared with a newly delivered luxury development.
Context matters.
Benchmark #2: Economic Occupancy
Economic occupancy often tells a much more accurate story.
High concessions.
Bad debt.
Delinquencies.
Vacancy loss.
All reduce actual income.
Two properties with identical physical occupancy can produce dramatically different cash flow.
Professional investors increasingly benchmark economic occupancy before evaluating pricing strategies.
Benchmark #3: Lease Renewal Rate
Renewal performance varies significantly across markets.
Rather than asking:
"Is a 60% renewal rate good?"
Professional owners ask:
"How does this compare with similar properties in my market?"
Higher-than-market renewal rates usually indicate:
- Better resident satisfaction
- Stronger operations
- Lower turnover costs
- Greater revenue stability
Benchmark #4: Leasing Velocity
How quickly are vacant units returning to revenue-producing assets?
Key benchmarks include:
Average days vacant.
Lead response time.
Tour-to-lease conversion.
Application approval speed.
Lease execution time.
Every delay reduces annual NOI.
Benchmark #5: Operating Expense Ratio
Expense growth continues to pressure owners across the United States.
Insurance.
Payroll.
Utilities.
Repairs.
Taxes.
Monitoring expenses alone isn't enough.
Owners should compare operating expense ratios against similar multifamily assets to identify operational inefficiencies.
Benchmark #6: Maintenance Performance
Maintenance has evolved from a service function into a strategic performance indicator.
Benchmark:
Average response time.
Completion time.
Preventive maintenance completion.
Emergency work orders.
Resident satisfaction after repairs.
Properties with faster maintenance performance frequently report stronger renewal rates and higher online ratings.
Benchmark #7: Resident Satisfaction
Institutional owners increasingly monitor:
NPS.
Resident surveys.
Google Reviews.
Online reputation.
Referral activity.
These metrics often predict future occupancy performance before traditional financial reports reveal problems.
Benchmark #8: NOI Growth
Ultimately, every benchmark leads back to NOI.
Professional investors compare:
Year-over-year NOI growth.
Market average NOI growth.
Budget variance.
Operating margin.
Expense growth.
Revenue growth.
This provides a comprehensive understanding of operational execution.
Benchmarking Property Managers—Not Just Properties
One of the most overlooked applications of benchmarking is evaluating property management companies themselves.
Many owners compare management fees.
Far fewer compare operational performance.
Questions worth asking include:
- Which manager consistently achieves higher occupancy?
- Which manager delivers better resident retention?
- Which manager reduces maintenance response times?
- Which manager controls operating expenses more effectively?
- Which manager provides better reporting?
- Which manager adopts new technology faster?
Comparing managers based on measurable outcomes—not marketing promises—leads to better long-term investment performance.
Technology Is Making Benchmarking More Accessible
Until recently, benchmarking was largely available only to institutional investors with large research budgets.
Today, cloud-based platforms, AI analytics, and business intelligence dashboards have democratized access to operational benchmarking.
Owners can increasingly compare their portfolios against market trends in near real time.
Artificial intelligence is also helping identify patterns that traditional reports often overlook.
The future of property management isn't simply reporting data.
It's generating actionable insights.
Why Benchmarking Matters More in 2026
Several industry trends have increased the importance of benchmarking:
- Elevated operating expenses.
- Slower national rent growth compared with the post-pandemic surge.
- Continued new multifamily deliveries in many Sun Belt markets.
- Rising insurance and labor costs.
- Higher resident expectations.
- Rapid adoption of AI-powered operational technology.
As margins tighten, even modest performance improvements can have an outsized impact on asset value.
Owners who consistently benchmark their portfolios are better positioned to identify inefficiencies before they become financial problems.
How Proplexa Helps Owners Make Better Comparisons
Benchmarking doesn't stop with evaluating properties.
It begins with evaluating the companies responsible for operating them.
Proplexa enables property owners to receive multiple proposals from qualified property management companies and compare them side by side.
Rather than focusing exclusively on management fees, owners can evaluate experience, technology, reporting capabilities, operational processes, and overall value.
Better comparisons lead to better management decisions.
Better management decisions lead to stronger portfolio performance.
Final Thoughts
The question isn't whether your property is performing well.
The real question is whether it's performing as well as it should.
Benchmarking transforms isolated metrics into meaningful business intelligence.
It helps owners identify hidden opportunities.
Reduce operational risk.
Improve NOI.
Protect long-term asset value.
In 2026, the most successful investors aren't simply collecting data.
They're measuring themselves against the best.
And that's exactly how competitive advantage is built.